
You have Google Analytics installed on your website and now you have a wealth of data at your fingertips. Your boss asks you to put together an analysis of the company’s digital marketing efforts and where you suggest your marketing dollars are allocated for the upcoming quarter.
Your first thought may be to put together a table that includes traffic and conversions by channel and suggest to your boss to allocate budget based on the % contribution of goal completions. This is a great place to start, but the analyst in you is going to need to spend some time with the data before you can provide any recommendations.
Path From Data To Wisdom
Just having the data is only the beginning. It’s important to note that the data doesn’t need to be perfect, but it does need to be statistically relevant in order to be reliable.
The next step after collecting the data is understanding the meaning of the data. For example, why some numbers can be averaged (ex. Bounce rate) and why others cannot (ex. Transactions). Other considerations could include understanding what you’re considering a goal on your website and whether or not that is a direct indicator of a successful action to brings your organization value. A product purchase or lead form submission will in most cases be a better indicator than, for example, a user spending more than four minutes on your website.
Knowledge is understanding the context of the data. One example of understanding the context of the data is “we’re 10% less than what our monthly growth has been over the past three months.” A more specific example of understanding the context is knowing organic homepage traffic is down year over year because you recently launched a branded paid search campaign that is driving traffic to the site. Data without context is irrelevant and can lead to bad decisions.
Lastly, wisdom is acting on that knowledge. It could be shifting budget from lower to upper funnel initiatives in Facebook, and leveraging other tactics like Adwords remarketing to capture this Facebook traffic. Historically, your conversion rate in display remarketing is higher which we’ll discuss a bit more later on.
Tips To Understanding / Contextualizing The Data
There are many ways to understand and contextualize your data. Here’s a couple of ways to get you started.
Segmentation
Simply looking at the overall sessions to your website and seeing they’re up year over year does not provide you much value. Leverage segments in Google Analytics (either custom or built-in) to further slice and dice your data. Here’s a few examples of segments we commonly use.
- Converters vs. Non-converters
- United States vs. EU
- New vs. Returning Users
- Facebook vs. Twitter Traffic
- Mobile vs. Desktop Traffic
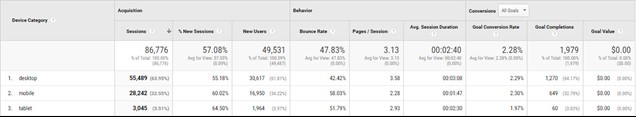
In the above image, I’ve broken out paid traffic by device type. When you dig one level deeper, you can see that paid traffic views half as many pages, spends half as much time on the site, and converts 60% less than desktop. It would be logical using this data alone to optimize your ads towards desktop.
Attribution
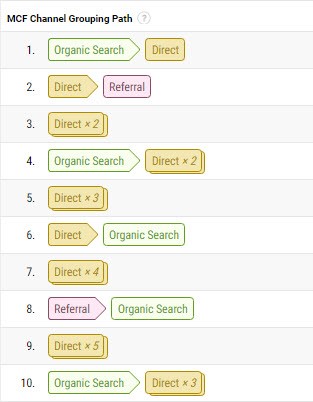
Users typically consult multiple channels before they’re ready to convert on your website. While not all channels are trackable (i.e. review websites), Google Analytics does a good job of visualizing the data it has on hand. Here’s an image of the “Top Conversion Paths” report you can find in Google Analytics.
Google Analytics’ standard reports default to last non-direct click when they attribute conversions to channels. This means that Google will credit 100% of the conversions to the last channel that drove that user to convert. If direct (or when a user goes to your site directly from the search bar) is the last channel, Google would move up the path until it finds a non-direct channel.
In the first path above, Referral would get 100% of the conversion count and value in your standard reports. Standard reports are anything that live under the Audience, Acquisition, Behavior, and Conversion (Goals and Ecommerce sub navigations) tabs in Google Analytics. When viewing reports under Conversions > Multi-Channel Funnels, Google Analytics defaults to the last click. So in the example above, Direct would get the conversion when viewing the MCF reports.
Understanding different ways to provide credit for different paths provides a wealth of information. In the image above, there’s one group of users that start with paid search, come back organically, and visit the website directly before converting. In the traditional attribution model, Paid would get no credit but when you take a step back, you acknowledge these users may have never known who you were, but were introduced through a paid ad and later converted. On one hand, you pull your ad dollars, on the other, you increase spend on your top-funnel paid efforts to generate new customers.
To learn more about the different attribution models available in Google Analytics, visit the Attribution Modeling Overview on the Google support site.
How To Make The Data Actionable
Now that you have accurate data, you understand what you’re looking at and provide context to the data by evaluating segments and understanding various attribution models. It’s time to put your research together to tell the story.
It’s important to call out that there is no substitute for knowing your data inside and out. Spending time drilling down into reports is invaluable as opposed to looking for green or red percentage changes on your metrics and then leaving.
Analytics
About the author
Dan Kipp
Dan Kipp is the Google Analytics and Google Tag Manager guru at Marcel Digital. He loves traveling, cooking, sports, and spending spare time with friends and family.